
Apache Spark architecture: what actually happens when you call an action
A walk through the Spark runtime from the driver down to a single task: who schedules what, where memory goes, how a shuffle is written, and which class to read when a job misbehaves.
- Architecture: what are the moving parts?
- Is this a master-worker architecture?
- Who does what, step by step?
- When does anything actually run?
- How does one action become tasks?
- What is an RDD, and does it still matter?
- Why do stages break where they do?
- Where does a task actually run?
- What happens when an executor is lost?
- Where does the driver run, and does it matter?
- Where does the memory go?
- What happens during a shuffle?
- How do tasks send data back, and receive it?
- Who turns the plan into code?
- Reading it from a running job
- When is this not the right engine?
- Production tips
- Frequently asked questions
- Conclusion
- References
- Trademarks
TL;DR
- The cluster manager is only a resource broker. Once executors register, the driver schedules every task itself and executors exchange shuffle blocks directly, which is why losing the driver kills the application and losing one executor does not.
- A job is one action, tasks are partitions, and stage boundaries fall exactly where a
ShuffleDependencyappears in the lineage. Everything else pipelines into one stage.SortShuffleManagerpicks between three shuffle writers in a fixed order, cheapest first. A map-side combine, which is whatreduceByKeydoes, disqualifies the two fast ones immediately.- Execution and storage share one memory pool, but the eviction is one-way: execution can evict cached blocks, storage can never evict execution.
- Spark 4 removed Mesos. Standalone, YARN and Kubernetes are the cluster managers now.
Most Spark tuning advice is a list of configs with no map of what they touch.
You raise spark.sql.shuffle.partitions because a post said so, and when it
does not help you have no way to reason about why, because the thing the knob
acts on is invisible.
This is the map. It follows one count() from the line you typed to the bytes
on an executor’s disk, naming the class responsible at each step so you can read
the source when the behaviour surprises you. By the end you should be able to
look at a slow stage in the Spark UI and say which component is struggling,
rather than which config to try next.
Assumed knowledge: you have written Spark jobs and know what a DataFrame is. No internals knowledge is assumed, and every component is defined on first use.
Architecture: what are the moving parts?
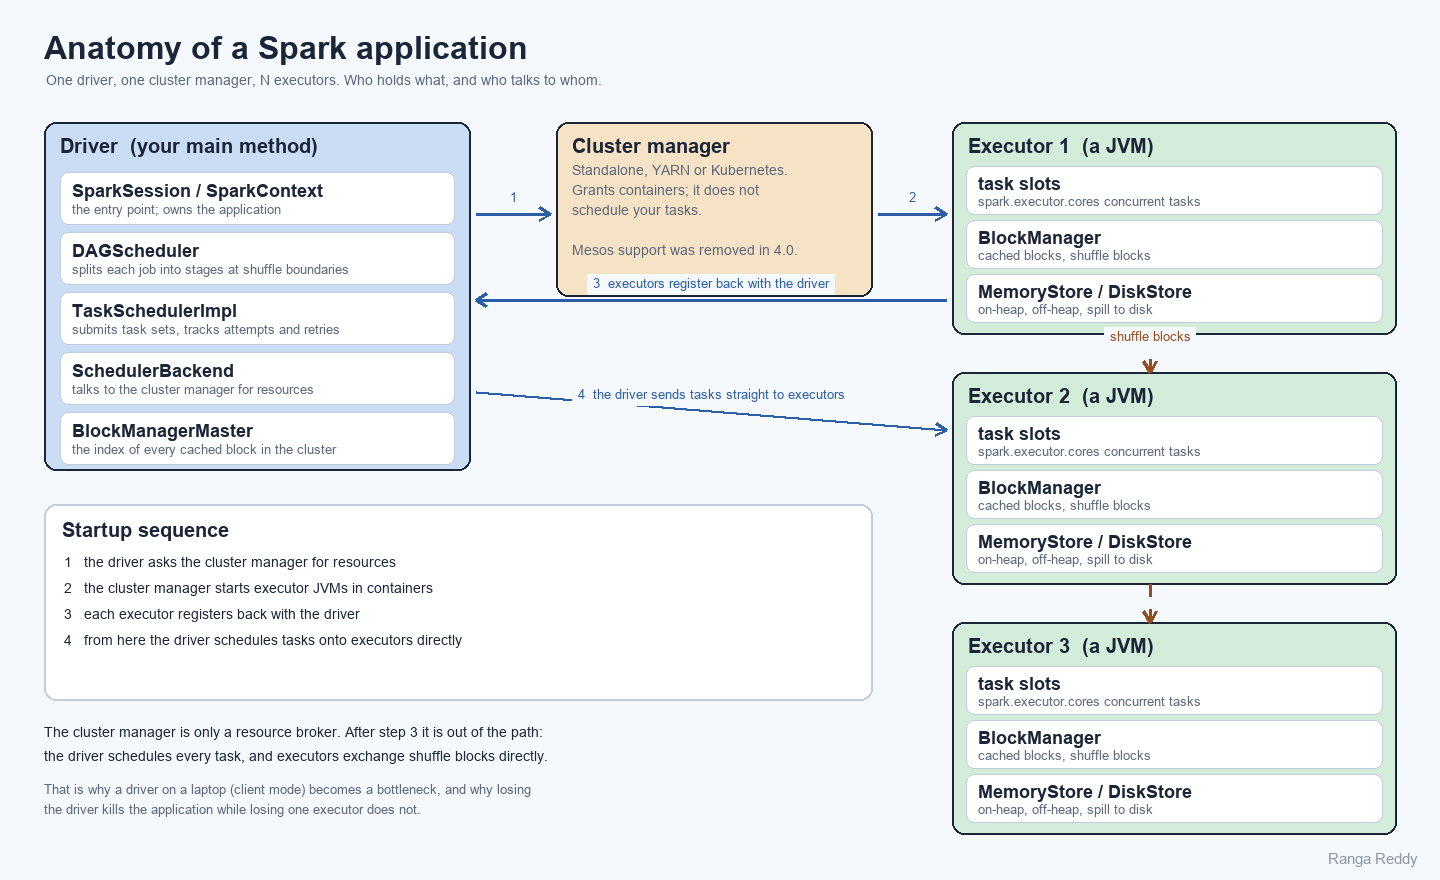
| Component | Where it runs | What it owns |
|---|---|---|
| Driver | One JVM, in a container or on your machine | The SparkSession, the plan, and every scheduling decision |
DAGScheduler |
Driver | Cuts a job into stages at shuffle boundaries, resubmits stages when shuffle output is lost |
TaskSchedulerImpl |
Driver | Places individual tasks on executors, tracks attempts, handles retries and speculation |
SchedulerBackend |
Driver | The one piece that talks to the cluster manager, with an implementation per manager |
BlockManagerMaster |
Driver | The index of every cached and shuffle block in the cluster |
| Cluster manager | Separate service | Grants containers. Standalone, YARN or Kubernetes |
| Executor | One JVM per container | Runs tasks in slots, holds cached and shuffle blocks |
BlockManager |
Executor and driver | Stores and serves blocks, backed by MemoryStore and DiskStore |
The division worth internalising is that the cluster manager never schedules
your work. It hands out containers, executors register back with the driver,
and from that point the driver drives everything. That single fact explains a
lot of otherwise puzzling behaviour: why an under-provisioned driver throttles a
large cluster, why collect() on a big result kills the application rather than
an executor, and why YARN’s own scheduler settings have no effect on how your
tasks are distributed.
Is this a master-worker architecture?
Yes, in the usual sense: one process coordinates and many processes do the work. But Spark’s own vocabulary is worth getting exactly right, because the word “master” is overloaded and people conflate three different things with it.
| Term | What it actually is | What it is not |
|---|---|---|
| Driver | The coordinator. Holds the plan, schedules every task | Not called the master anywhere in Spark |
--master |
A URL naming the cluster manager (yarn, k8s://…, local[*]) |
Not a machine, and not the driver |
| Standalone Master | A daemon in standalone mode that tracks workers and grants resources | Only exists in standalone mode; YARN and Kubernetes have their own |
| Worker | A machine, or the standalone daemon running on one | Not an executor. A worker hosts executors |
| Executor | A JVM doing the work | Not a machine |
Spark has also moved away from the older terminology in its own scripts. At
v4.2.0 there is sbin/start-workers.sh and conf/workers.template;
start-slaves.sh and slaves.template are gone, and the standalone
documentation speaks of “a master and workers”.
The analogy breaks in one place worth knowing. In a classic master-worker system, the master assigns work. In Spark the cluster manager does not assign your tasks: it grants containers, and the driver schedules into them. So the coordinator role is split, resources from one component and work from another, which is why tuning YARN’s scheduler changes what you are given but never how your tasks are distributed.
Who does what, step by step?
Three components, and the clearest way to hold them is by what each is responsible for and what it explicitly is not.
| Driver | Cluster manager | Executor | |
|---|---|---|---|
| Runs | One JVM, in a container or on your machine | A separate service | One JVM per container |
| Owns | SparkSession, the plan, scheduler state, the block index |
The pool of cluster resources | Task slots, cached blocks, shuffle blocks |
| Does | Parses code, builds and optimises the plan, cuts stages, schedules tasks, tracks results | Grants and reclaims containers | Runs tasks, stores blocks, serves shuffle data to peers |
| Does not | Process data | Schedule your tasks or see your plan | Make any scheduling decision |
| If it dies | The application dies | Running executors continue; no new ones | Its tasks are retried elsewhere, cached blocks recomputed |
What does the driver do?
The driver is where all the thinking happens. In order, for every application:
- Creates the
SparkSession, which brings upSparkContext,SparkEnv, the block manager and the RPC endpoints the executors will call back on. - Asks for executors.
SchedulerBackendrequests resources from whichever cluster manager--masternamed. Static allocation asks once forspark.executor.instances, which has no default in core and is documented as2on YARN. - Turns your code into a plan. Unresolved logical plan, then analysed against the catalog, then optimised by Catalyst, then a physical plan chosen by cost.
- Cuts the plan into stages.
DAGSchedulerwalks the RDD lineage and breaks it at everyShuffleDependency, producing a DAG of stages and aTaskSetper stage. - Places every task.
TaskSchedulerImplandTaskSetManagerdecide which executor runs which task, preferring the best available locality level. - Tracks every attempt. Failed tasks are retried up to
spark.task.maxFailures, which defaults to4. Slow tasks may be speculatively duplicated. A stage whose shuffle output was lost is resubmitted. - Keeps the block index.
BlockManagerMasteron the driver knows where every cached partition and shuffle block lives, so executors can fetch from each other. - Receives results. Task results come back through the scheduler, bounded
in total by
spark.driver.maxResultSize, which defaults to1g. - Serves the UI on port 4040 while the application runs, and writes the event log the history server replays afterwards.
The driver defaults to spark.driver.memory of 1g, which is fine for a
coordinator and not fine for anything that pulls data back. It is also the one
process with no redundancy: if the driver dies the application dies, because
the plan, the scheduler state and the block index all die with it.
What does an executor do?
Much less, deliberately. The source describes it in one line as a “Spark executor, backed by a threadpool to run tasks”. The lifecycle is:
- Registers with the driver.
CoarseGrainedExecutorBackendsendsRegisterExecutorand waits forRegisteredExecutorbefore it will accept work. Until that round trip completes, a granted container is doing nothing. - Accepts
LaunchTaskmessages and runs each one in a thread from the pool. The number of concurrent tasks isspark.executor.cores, which defaults to1on YARN and to every core on the machine in standalone mode. - Reads its input, runs the generated code over it, and for a shuffle map stage writes shuffle output to local disk.
- Reports back with
StatusUpdateper task, and sends a heartbeat everyspark.executor.heartbeatInterval, which defaults to10s. Miss enough of those and the driver declares the executor lost. - Stores and serves blocks through its
BlockManager, which is what makes a cached DataFrame reusable and what lets the next stage fetch shuffle data from its peers.
An executor never makes a scheduling decision, never sees the query plan, and never talks to another executor about what to run. It receives tasks, runs them, and serves bytes. That is the whole contract, and it is why executors are disposable: lose one and its tasks are retried elsewhere, with cached partitions recomputed from lineage.
What does the cluster manager do?
Exactly one thing: decide who gets containers. It is a resource manager rather than a work scheduler, and how it does the job is the only part that changes between deployments.
| Cluster manager | What grants the container | What Spark runs there |
|---|---|---|
| Standalone | Master, which tracks registered Worker daemons |
The worker launches an executor JVM per grant |
| YARN | The ResourceManager, asked by Spark’s ApplicationMaster through YarnAllocator |
An executor per allocated container |
| Kubernetes | The API server. The driver’s own ExecutorPodsAllocator creates the pods |
An executor per pod |
Kubernetes is the clearest illustration of the split, because there is no Spark cluster-manager daemon at all: the driver talks to the API server directly and asks for pods. The component granting resources and the component scheduling work are simply different things, however they happen to be packaged.
Two defaults follow from this. spark.dynamicAllocation.enabled is false, so
absent a decision your application holds its executors from first request to
exit, idle or not. And Mesos support was removed in the 4.x line, so the
three rows above are the whole list.
And the end-to-end flow, from the line you type to the result you get back:
flowchart TB
  S1["<b>1</b>  you call an action<br/><i>count, collect, write</i>"] --> S2["<b>2</b>  driver builds the logical plan<br/><i>unresolved, then analysed</i>"]
  S2 --> S3["<b>3</b>  Catalyst optimises and<br/>selects a physical plan"]
  S3 --> S4["<b>4</b>  DAGScheduler cuts stages<br/><i>at every ShuffleDependency</i>"]
  S4 --> S5["<b>5</b>  driver asks the cluster manager<br/>for executors, if it has none"]
  S5 --> S6["<b>6</b>  TaskSchedulerImpl places tasks,<br/><i>best locality first</i>"]
  S6 --> S7["<b>7</b>  executors run tasks and write<br/>shuffle output for the next stage"]
  S7 --> S8{"more stages?"}
  S8 -->|"yes"| S6
  S8 -->|"no"| S9["<b>8</b>  results return to the driver,<br/>or are written by the executors"]
Step 8 has a fork worth noticing. collect() pulls every row back to the
driver, bounded only by spark.driver.maxResultSize.
write does not: each executor writes its own partition directly to storage and
returns only a status. Same job shape, completely different driver cost.
Steps 6 and 7 repeat per stage. That loop is where adaptive query execution intervenes, because between two passes it has real statistics from the stage that just finished.
When does anything actually run?
Nothing runs until you ask for a result. The RDD programming guide states the split plainly: RDDs support “transformations, which create a new dataset from an existing one, and actions, which return a value to the driver program after running a computation on the dataset”. And then the rule that everything else follows from:
All transformations in Spark are lazy, in that they do not compute their results right away. Instead, they just remember the transformations applied to some base dataset.
| Transformation | Action | |
|---|---|---|
| Examples | map, filter, select, groupBy, join, repartition |
count, collect, show, first, take, write |
| Returns | A new dataset | A value to the driver, or a write to storage |
| Runs | Nothing yet | Submits a job |
You can watch the boundary rather than take it on faith. Chaining transformations submits no job; the action submits one:
rdd = spark.sparkContext.parallelize(range(4), 2)
doubled = rdd.map(lambda x: x * 2).filter(lambda x: x > 2)
print(len(spark.sparkContext.statusTracker().getJobIdsForGroup() or []))   # 0
doubled.count()
print(len(spark.sparkContext.statusTracker().getJobIdsForGroup() or []))   # 1
This is why the unit of work is the action, and why everything in the rest of this post hangs off one. It is also why a plan can be optimised at all: Catalyst gets to see the whole chain before any of it has run.
The cost is that a dataset is recomputed every time an action needs it, unless you persist it. The guide is explicit: “each transformed RDD may be recomputed each time you run an action on it”.
How does one action become tasks?
Nothing runs until an action. filter, select and join add to a plan;
count, collect, show and write execute it. When an action fires,
DAGScheduler walks the plan backwards and cuts it into stages wherever the
data has to move between partitions.
flowchart LR
  subgraph ST1["stage 0: narrow, no shuffle"]
    direction LR
    R["read parquet<br/>8 partitions"] --> F["filter"]
    F --> W["withColumn"]
  end

  subgraph ST2["stage 1: after the shuffle"]
    direction LR
    AG["aggregate"] --> WR["write, the action"]
  end

  W -->|"shuffle: groupBy city_id"| AG
| Unit | Rule | Class |
|---|---|---|
| Job | One per action | DAGScheduler.submitJob |
| Stage | Wide transformations plus one | ShuffleMapStage, ResultStage |
| Task | One per partition, per stage | TaskSetManager |
Every stage but the last is a ShuffleMapStage: its job is to produce shuffle
output for the next stage. The last is a ResultStage, which computes the
answer the action asked for. That is why the Spark UI shows a final stage with a
different shape from the rest.
A concrete count, on a table that reads as 8 partitions:
from pyspark.sql.functions import col, when

trips = spark.read.parquet("s3a://lakehouse-prod/warehouse/trips")
print(trips.rdd.getNumPartitions())                                  # say it is 8

by_city = (trips
    .filter(col("fare_amount") > 50)                                 # narrow
    .withColumn("band", when(col("fare_amount") > 100, "high")
                        .otherwise("mid"))                           # narrow
    .groupBy("city_id").count())                                     # WIDE

by_city.write.parquet("s3a://lakehouse-prod/warehouse/trips_by_city")
One action, so one job. One wide transformation, so two stages. Eight input
partitions, so eight tasks in stage 0, and spark.sql.shuffle.partitions tasks
in stage 1 unless adaptive execution coalesces them.
Where does the input partition count come from?
Not from the number of files, which is the assumption that costs people the most
time. FilePartition.maxSplitBytes decides the split size first:
Math.min(defaultMaxSplitBytes, Math.max(openCostInBytes, bytesPerCore))
defaultMaxSplitBytes is spark.sql.files.maxPartitionBytes, default 128MB.
openCostInBytes is spark.sql.files.openCostInBytes, default 4MB, and it is
charged per file so that many small files are packed together rather than each
getting a task. bytesPerCore is the total size divided by
spark.sql.files.minPartitionNum, which falls back to the default parallelism.
The consequence is that a directory of small files collapses into far fewer
partitions than it has files, and a single file larger than the split size is
divided into several. Read the number rather than predicting it, which is what
the getNumPartitions() line above is for.
What is an RDD, and does it still matter?
Everything above sits on one abstraction. A Resilient Distributed Dataset
is a partitioned, immutable collection that knows how to rebuild itself.
RDD.scala states the five properties that define one:
| Property | Member | What it gives the scheduler |
|---|---|---|
| A list of partitions | getPartitions |
How many tasks this stage needs |
| A function for computing each split | compute |
What a task actually runs |
| A list of dependencies on other RDDs | getDependencies |
Where the stage boundaries fall |
Optionally, a Partitioner |
partitioner |
Whether a shuffle can be skipped because data is already co-located |
| Optionally, preferred locations per split | getPreferredLocations |
The locality levels TaskSchedulerImpl tries |
The source is explicit that this is not incidental: “All of the scheduling and execution in Spark is done based on these methods.” Every component in this post reads one of those five.
Resilient is the third property doing work. An RDD records what it was computed from, which is the lineage mentioned earlier. Lose a partition and Spark replays the function against the parent rather than checkpointing state, which is why executor loss is survivable and driver loss is not: lineage lives on the driver.
You almost certainly do not write RDD code any more, and that is fine. A
DataFrame is a higher-level API that Catalyst optimises and then compiles down
to exactly these objects, which is why df.rdd.getNumPartitions() works and why
the Spark UI still talks about RDDs. The abstraction did not go away; it stopped
being the thing you type.
Why do stages break where they do?
Stage boundaries are not a heuristic. They fall out of the dependency type
between one RDD and its parent, and Dependency.scala defines exactly two
families.
NarrowDependency, in the source’s own words, is where “each partition of
the child RDD depends on a small number of partitions of the parent RDD”,
and it notes that narrow dependencies “allow for pipelined execution”. Two
concrete subclasses:
| Class | Shape |
|---|---|
OneToOneDependency |
Child partition n reads parent partition n. What map and filter produce |
RangeDependency |
A contiguous range of parent partitions maps to a range of child ones. What union produces |
ShuffleDependency is the other family: a dependency on the output of a
shuffle stage, carrying the Partitioner that decides which reducer each record
belongs to.
flowchart TB
  subgraph NW["narrow: pipelined into one stage"]
    direction LR
    N1["p1"] --> N1b["p1'"]
    N2["p2"] --> N2b["p2'"]
    N3["p3"] --> N3b["p3'"]
  end

  subgraph WD["wide: a ShuffleDependency, so a new stage"]
    direction LR
    W1["p1"] --> X1["p1'"]
    W1 --> X2["p2'"]
    W2["p2"] --> X1
    W2 --> X2
    W3["p3"] --> X1
    W3 --> X2
  end

  NW ~~~ WD
That is the whole rule. DAGScheduler walks the lineage backwards, and every
ShuffleDependency it meets ends a stage. Counting the wide transformations in
your code therefore predicts your stage count before you run anything, and it is
why a broadcast join is worth forcing: it converts a ShuffleDependency into a
narrow one, removing a stage boundary entirely.
Where does a task actually run?
TaskSchedulerImpl does not place tasks arbitrarily. It offers each task the
best locality it can get, and waits a little before settling for worse.
TaskLocality defines five levels, in this order:
| Level | Meaning |
|---|---|
PROCESS_LOCAL |
The data is already in this executor’s BlockManager. The best case |
NODE_LOCAL |
The data is on this node, in another executor or on local disk |
NO_PREF |
No preference, typical of data read over the network |
RACK_LOCAL |
The data is on another node in the same rack |
ANY |
Anywhere |
spark.locality.wait (default 3s) is how long the scheduler holds out for a
better level before giving up and taking the next one. That default is the
reason a job on a busy cluster sometimes appears to stall between stages: the
scheduler is waiting for a local slot rather than doing nothing.
Each executor runs spark.executor.cores tasks at once, and each task takes
spark.task.cpus (default 1) of them. The two together, not the executor
count alone, decide your real parallelism.
What happens when an executor is lost?
The work is redone, and the reason it can be redone is that Spark recorded how to build every partition rather than only the partition itself. That record is the lineage: the chain of transformations from a source to the dataset in hand.
lineage = (spark.sparkContext.parallelize(range(10), 2)
    .map(lambda x: x + 1)
    .filter(lambda x: x % 2 == 0))
print(lineage.toDebugString().decode())
Recovery is per partition, not per job. Losing one executor costs the partitions
it held, which are rebuilt from lineage on whichever executors remain, while
everything else stands. A task is retried up to spark.task.maxFailures, which
defaults to 4, before the stage is failed.
Shuffle output is the exception worth knowing. If the shuffle files a completed
stage wrote are lost with their executor, the DAGScheduler resubmits that
stage, because the next stage has nothing to fetch. That is a stage rerun rather
than a task retry, and it is why a job can appear to go backwards in the UI.
The driver has no equivalent. Its state is the plan, the scheduler and the block index, none of which is recorded anywhere else, so losing the driver ends the application.
Where does the driver run, and does it matter?
The cluster manager decides where executors go. --deploy-mode decides where
the driver goes, and that choice has consequences the other articles on this
topic tend to skip.
| Mode | Driver runs | Submitting machine | Use it for |
|---|---|---|---|
cluster |
In a container the cluster manager allocates | Can disconnect once the job is accepted | Production and scheduled jobs |
client |
In the spark-submit process itself |
Must stay up for the whole job | Interactive work, notebooks, shells |
local[N] |
Everything in one JVM, N threads | It is the whole cluster | Tests and development |
SparkSubmit rejects combinations that cannot work, and the error text is worth
recognising:
Cluster deploy mode is not compatible with master "local"
Cluster deploy mode is not applicable to Spark shells.
Cluster deploy mode is currently not supported for python applications on standalone clusters.
The first is a category error: local has no cluster to put a driver in. The
second is the interesting one, and it explains why every interactive session is
client mode. A shell needs a REPL attached to the driver, so the driver has to
be where you are. That in turn is why a collect() sized for a production
cluster can exhaust the heap on your laptop, and why closing the laptop ends the
job.
One piece of vocabulary these diagrams often blur: a worker node is a
machine in the cluster, while an executor is a JVM running on one. A node
can host several executors, and spark.executor.cores is slots per executor,
not per node. Sizing decisions are about executors; capacity planning is about
nodes.
Where does the memory go?
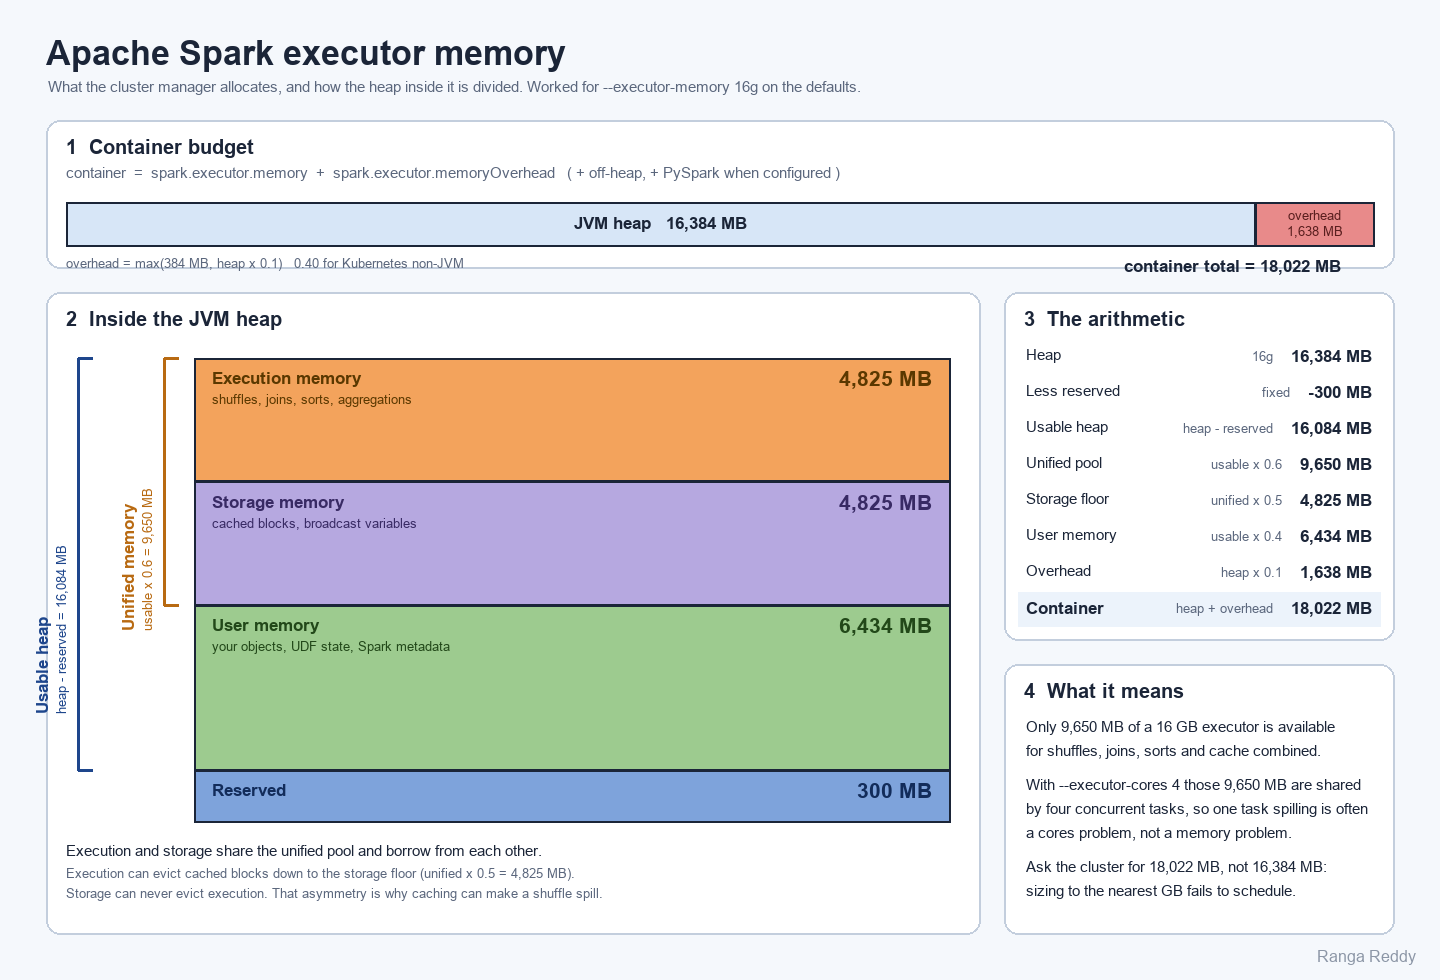
The formula is in UnifiedMemoryManager: subtract a fixed 300 MB, then take
spark.memory.fraction of the rest. For --executor-memory 16g on the
defaults, that leaves 9,650 MB shared between shuffles, joins, sorts and cache
combined, and asks the cluster for 18,022 MB once overhead is added.
The behaviour that matters more than the numbers is the asymmetry. Execution and
storage draw from one pool and borrow from each other, but execution can evict
cached blocks down to the storage floor, and storage can never evict
execution. Caching a large DataFrame therefore cannot fail a shuffle, but it
can make one spill, which is how adding a cache() can make a job slower.
What happens during a shuffle?
A shuffle is the expensive thing every other decision is arranged around. The map side writes partitioned files, the reduce side fetches them.
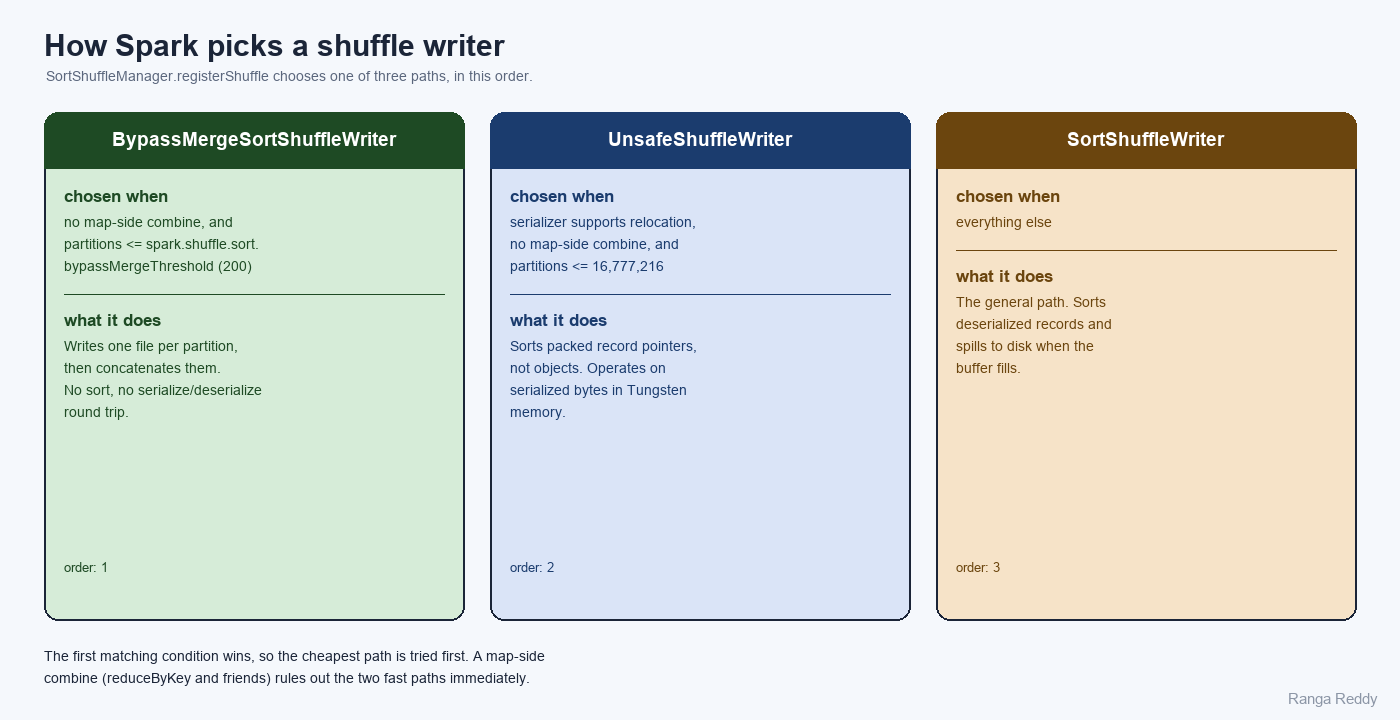
SortShuffleManager.registerShuffle picks between three writers in a fixed
order, and the conditions are worth knowing because they are checkable:
| Writer | Chosen when | Cost |
|---|---|---|
BypassMergeSortShuffleWriter |
No map-side combine, and partitions at or below spark.shuffle.sort.bypassMergeThreshold (200) |
Opens serializers and file streams for all partitions simultaneously, which is why it is capped at 200 |
UnsafeShuffleWriter |
Serializer supports relocating serialized objects, no map-side combine, partitions at or below 16,777,216 | Sorts pointers rather than objects, so it cannot combine on the map side |
SortShuffleWriter |
Everything else | Sorts deserialized records and spills, the most general and most expensive |
The condition that disqualifies both fast paths is mapSideCombine. That is
what reduceByKey and aggregateByKey set, which is the trade hiding behind
the usual advice to prefer them over groupByKey: they shuffle far less data
but give up the cheaper writers.
Knobs on the fetch side:
| Config | Default | What it does |
|---|---|---|
spark.shuffle.file.buffer |
32k |
Write buffer per shuffle file, so larger means fewer syscalls |
spark.reducer.maxSizeInFlight |
48m |
How much shuffle data a reducer fetches at once |
spark.shuffle.compress |
true |
Compress map output |
spark.shuffle.service.enabled |
false |
Serve shuffle blocks from an external service, so an executor can be lost or removed without losing its shuffle output |
That last default is the one to change deliberately. Without the external shuffle service, dynamic allocation cannot release an executor that still holds shuffle blocks another stage needs.
How do tasks send data back, and receive it?
A task runs in another JVM, so an ordinary variable captured by a closure is serialised, shipped and then thrown away. Updates to it never come back. Spark provides two shared variables for the two directions.
Broadcast variables go outward. They “allow the programmer to keep a read-only variable cached on each machine rather than shipping a copy of it with tasks”, which matters because the alternative sends the object once per task rather than once per executor.
sc = spark.sparkContext
cities = sc.broadcast({"sf": "San Francisco", "nyc": "New York"})
resolved = sc.parallelize(["sf", "nyc", "sf"], 2).map(lambda c: cities.value[c])
print(resolved.collect())   # ['San Francisco', 'New York', 'San Francisco']
Accumulators come back, and they carry a caveat that is easy to get wrong. The guide guarantees exactly-once only for updates made inside actions:
For accumulator updates performed inside actions only, Spark guarantees that each task’s update to the accumulator will only be applied once, i.e. restarted tasks will not update the value. In transformations, users should be aware of that each task’s update may be applied more than once if tasks or job stages are re-executed.
That is not a theoretical risk, and it follows directly from lazy evaluation: an uncached dataset is recomputed per action, and the accumulator increments again each time.
acc = sc.accumulator(0)
counted = sc.parallelize(range(100), 4).map(lambda x: (acc.add(1), x)[1])

counted.count()
print(acc.value)   # 100
counted.count()    # recomputed, so the accumulator runs again
print(acc.value)   # 200, for the same 100 rows
Add .cache() to that chain and the second action reuses the cached partitions,
so the value stays at 100. Use accumulators for diagnostics you can tolerate
being approximate, and never as the source of a number the output depends on.
Who turns the plan into code?
Everything above is the runtime. The plan it runs comes from Catalyst, which takes a query through four phases, each a set of rules over a tree.
flowchart LR
  SQL["SQL or DataFrame"] --> AN["<b>Analyzer</b><br/>resolve names<br/>against the catalog"]
  AN --> OPT["<b>Optimizer</b><br/>pushdown, pruning,<br/>constant folding"]
  OPT --> PLAN["<b>SparkPlanner</b><br/>strategies produce<br/>physical candidates"]
  PLAN --> CG["<b>WholeStageCodegenExec</b><br/>fuse operators into<br/>one Java method"]
  CG --> RDD["RDD[InternalRow]"]
  RDD -.->|"runtime statistics"| AQE["<b>AdaptiveSparkPlanExec</b>"]
  AQE -.-> PLAN
The dashed loop is adaptive query execution, on by default since 3.2. After a
stage completes, real statistics go back into planning, so the next stage’s
join strategy and partition count come from measured sizes rather than
estimates. It is why spark.sql.shuffle.partitions matters far less than it
used to: AQE coalesces toward
spark.sql.adaptive.advisoryPartitionSizeInBytes, which falls back to 64MB.
Catalyst can only optimise what it can see. A SQL expression is a tree it can rewrite; a Python UDF is an opaque function it must call as-is, which blocks pushdown across that point. That is the real cost of a UDF, and it is usually larger than the cost of the function itself.
Reading it from a running job
Every claim above is observable. This prints the structure the sections describe, without leaving the shell:
# How many partitions am I actually working with?
print("input partitions:", trips.rdd.getNumPartitions())

# Which plan did Catalyst settle on? "formatted" is the readable one.
by_city.explain("formatted")

# Did a join get broadcast, and was the filter pushed into the scan?
# Look for BroadcastHashJoin and PushedFilters in the output above.

# What is this executor's memory split, from the running JVM?
conf = spark.sparkContext.getConf()
for k in ("spark.executor.memory", "spark.executor.cores",
          "spark.memory.fraction", "spark.memory.storageFraction",
          "spark.sql.shuffle.partitions", "spark.sql.adaptive.enabled"):
    print(f"{k:42s} {conf.get(k, '(default)')}")
Which brings us back to the promise at the top. Read a slow stage this way:
| What the UI shows | Which component is struggling | Where to look next |
|---|---|---|
| A few tasks far slower than the median | Partitioning: the data is skewed | AQE skew settings, or salt the key |
| Large spill on most tasks | Execution memory in UnifiedMemoryManager |
Fewer cores per executor, or more partitions |
| Thousands of tasks, each milliseconds long | DAGScheduler over-partitioned the stage |
Coalesce, or let AQE do it |
Stage retries with FetchFailed |
Shuffle: an executor holding blocks was lost | Enable the external shuffle service |
| Long pause between stages, no tasks running | TaskSchedulerImpl waiting on locality |
Lower spark.locality.wait |
| Planning time exceeds execution time | Catalyst, not the runtime | Fewer files, or prune harder |
| Driver heap climbing to OOM | The driver itself | A collect, or a broadcast larger than estimated |
In the Spark UI, three pages answer most questions. The stages page gives task duration percentiles and spill columns, which is where skew shows up. The SQL tab gives the physical plan annotated with row counts, which answers “did my filter push down”. The storage tab shows what is cached and what fraction of it actually fits in memory.
When is this not the right engine?
Spark’s architecture assumes work worth distributing. Where that does not hold, the machinery is overhead you are paying for nothing.
Data that fits in memory on one machine. A few gigabytes is a pandas, DuckDB or Polars job. Spark’s scheduling, serialisation and shuffle machinery costs more than the computation saves.
Low-latency single-row lookups. Spark plans a job per action, with tens of milliseconds of overhead before any work starts. A key-value store or an indexed database answers those; Spark scans.
Very many tiny jobs. Each action pays planning and scheduling. Thousands of small jobs spend their time in the driver, which is why per-request work belongs in a service rather than a Spark application.
Spark earns its cost when the data does not fit on one machine, the work is expressible as transformations over partitions, and the job runs long enough for planning overhead to be a rounding error.
Production tips
- Size the container, not the heap. The cluster manager must grant
spark.executor.memoryplus overhead, roughly 10 percent more. Sizing to the nearest gigabyte fails to schedule. - Set
spark.executor.coresdeliberately. Four to five is the usual range; all the tasks on an executor share one heap, so more cores means less memory each. - Turn on the external shuffle service before dynamic allocation. Without it, executors holding shuffle blocks cannot be released.
- Leave adaptive execution on. It coalesces partitions and re-picks join strategies from real statistics, and it is on by default.
- Prefer
reduceByKeytogroupByKey, accepting that a map-side combine rules out the two cheaper shuffle writers. Shuffling less data is worth more. - Watch task duration percentiles, not averages. Skew is invisible in a mean and obvious in a max.
- Keep the driver off your laptop for production runs. Client mode puts the driver where you are sitting, so a
collect()that works on the cluster can exhaust your local heap.
Frequently asked questions
Why does my job have more jobs than actions?
Some operations run a hidden job first. show() can run one job to peek and
another to finish, and anything that samples or infers, such as reading JSON
without a schema or a sortBy computing range boundaries, runs its own job to
collect what it needs.
Losing an executor: what survives?
Its cached blocks are gone and will be recomputed from lineage, the record
Spark keeps of the transformations that produced each partition. Because that
record is held on the driver, any lost partition can be rebuilt by replaying the
steps that made it. Its shuffle
output is gone too, unless the external shuffle service is holding it, in which
case DAGScheduler can skip resubmitting the map stage.
Why is the driver a single point of failure but an executor is not? The driver holds the plan, the scheduler state and the block index. An executor holds only data that can be recomputed. There is no driver failover in the application itself; cluster-mode restart policies are what cover it.
Where does off-heap memory fit?
spark.memory.offHeap.enabled is false by default and spark.memory.offHeap.size
is 0. When enabled, Tungsten, Spark’s binary memory and
code-generation layer, allocates outside the JVM heap. That takes pressure off
garbage collection, at the cost of a second budget to manage.
Is Mesos still supported? No. It was removed in the Spark 4 line; the resource manager module is gone entirely. Standalone, YARN and Kubernetes are the options.
What is Spark Connect and does it change this picture? It splits the client from the driver: your application sends an unresolved plan over gRPC and a remote driver runs everything described above. The runtime is unchanged; what moves is where your code lives relative to the driver JVM.
Conclusion
Back to the config you raised without knowing what it touched. Almost every Spark tuning decision lands on one of three things: how many partitions there are, how large each one is, and whether the data has to move between them. The components in this post are just the machinery that answers those three questions, which is why a map of them is more durable than a list of settings.
The division that explains the most is between the cluster manager and the driver. The manager hands out containers and then leaves; the driver schedules every task, tracks every block, and holds state that nothing else can rebuild. Once that is clear, the behaviours that look arbitrary stop being arbitrary: the driver as a bottleneck, the driver as a single point of failure, and the cluster manager’s own scheduler settings having no effect on your task placement.
Read the plan before the configs. explain("formatted") and the SQL tab tell
you what Catalyst decided, the stages page tells you how that decision played
out across partitions, and only then does a config change have a target. A knob
turned without that is a guess, however good the post it came from.
References
- Spark configuration reference for every property, its default and the version it appeared in
- Apache Spark: the complete cheat sheet for the config surface this post explains
Trademarks
Apache Spark, Apache Hadoop, Apache Mesos, Apache Parquet and Apache are either registered trademarks or trademarks of The Apache Software Foundation in the United States and other countries. Kubernetes is a registered trademark of The Linux Foundation.
Found this useful?
These posts and tools are free. If one saved you an afternoon, you can buy me a coffee.