Life of a read query in Iceberg: four prunes before a byte of data is read
Planning an Iceberg query is a sequence of eliminations against metadata. Each level discards work the next level would have done, and the last one only works if your data is sorted. Here is each step with the metadata it reads.
- The four levels
- What makes the last prune fail
- Proving each prune fired
- When column bounds stop working
- The cost model, stated
- Why planning cost is metadata, not partitions
- Reading the evidence yourself
- Run it yourself
- Common misconceptions
- A model worth keeping
- References
- Trademarks
TL;DR
- Planning is four steps: catalog → metadata.json → manifest list → manifests → data files, and each discards candidates before the next runs.
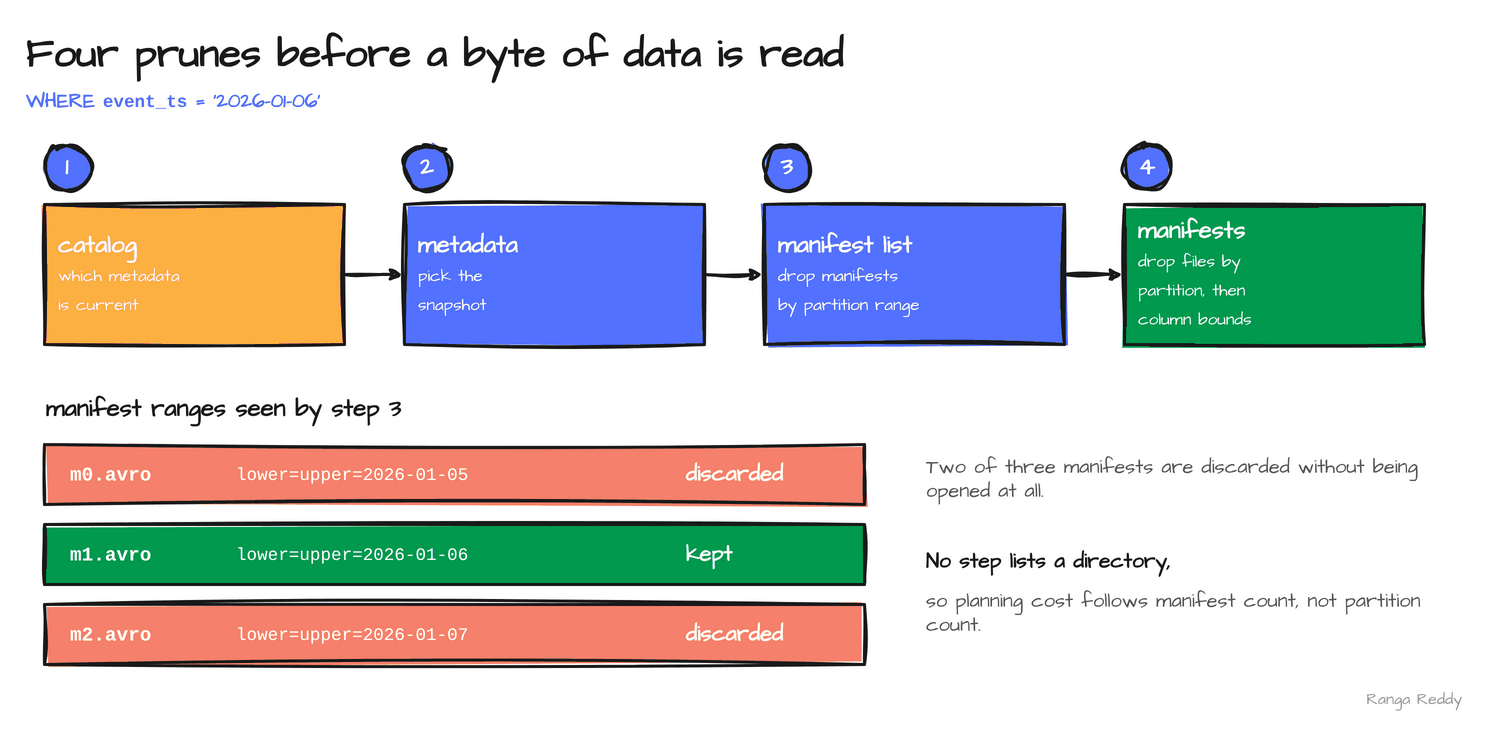
- The manifest list carries a partition range per manifest. A one-day filter discarded two of three manifests without opening them, and Spark’s scan counts it:
skippedDataManifests=2.- Manifests carry per-file column bounds keyed by field id, not column name — the same identity that makes renames safe.
- No step lists a directory. Planning cost scales with manifest count, which you control with
rewrite_manifests, not with partition count.- The column-bounds prune only works if data is sorted. Unsorted files all spanned
r0..r9, and aregion = 'r5'filter read 8 of 8 files; after a sort rewrite it read 2. A plain rewrite afterWRITE ORDERED BYstill read 6.
The four levels
A read query never asks the filesystem what exists. It asks metadata, and each level of metadata is smaller and more selective than the data below it.
flowchart TB
    Q["SELECT ... WHERE event_ts = '2026-01-06'"] --> C["1. catalog<br/>which metadata.json is current?"]
    C --> M["2. metadata.json<br/>schema, specs, snapshot list"]
    M --> ML["3. manifest list<br/>drop manifests by partition range"]
    ML --> MF["4. manifests<br/>drop files by partition value<br/>then by column bounds"]
    MF --> D["open the surviving Parquet files"]
1. The catalog resolves the pointer
One lookup: for this table name, which metadata file is current? That answer is the isolation boundary. Every subsequent step reads from that one file, so a commit landing mid-query cannot change what this query sees.
2. The metadata file selects a snapshot
The metadata file holds the schema, every partition spec the table has ever used, and the snapshot list. Normally the current snapshot is chosen; a time-travel query picks a different one by id or timestamp. Everything downstream is relative to that choice.
3. The manifest list drops whole manifests
This is where the first real elimination happens, and it is cheap because the manifest list is one small Avro file summarising each manifest, including the range of partition values inside it.
From a table partitioned by days(event_ts) with one commit per day, read from
the manifests metadata table:
manifest 73fea259...-m0.avro files=1  lower_bound=2026-01-05 upper_bound=2026-01-05
manifest 4ec83c25...-m0.avro files=1  lower_bound=2026-01-06 upper_bound=2026-01-06
manifest bfc2a596...-m0.avro files=1  lower_bound=2026-01-07 upper_bound=2026-01-07
A filter for 2026-01-06 keeps the middle manifest and discards the other two without opening them. Spark’s Iceberg scan reports exactly that:
scan metrics: {'scannedDataManifests': 1, 'skippedDataManifests': 2, 'resultDataFiles': 1, 'skippedDataFiles': 0}
On a real table where one manifest covers hundreds of files, that is hundreds of files eliminated by reading a few hundred bytes.
4. Manifests drop individual files
Surviving manifests are opened, and they carry, per data file, the partition value and the min/max of each column:
day=2026-01-05 rows=3000 region=[r0 .. r9] bounds keyed by field ids [1, 2, 3, 4]
day=2026-01-06 rows=3000 region=[r0 .. r9] bounds keyed by field ids [1, 2, 3, 4]
day=2026-01-07 rows=3000 region=[r0 .. r9] bounds keyed by field ids [1, 2, 3, 4]
field ids: [('event_id', 1), ('event_ts', 2), ('region', 3), ('reading', 4)]
Two prunes happen here. The partition value eliminates files in the wrong
partition. Then column bounds eliminate files whose min/max cannot contain a
matching row: a filter region = 'r5' against a file whose region range is
r0..r2 skips it without reading it. Here every file spans r0..r9,
because events arrive in no particular region order, so that second prune has
nothing to discard. What makes the last prune fail
measures exactly this.
The bounds keys are field ids. 3 is region because the schema says field 3
is named region today. Rename the column and the bounds keep working, because
nothing recorded the name. readable_metrics in the files table, used above,
translates those ids back to column names for you.
Hidden partitioning at read time
The query does not mention the partition column:
SELECT count(*) FROM ice.blog_read_path.events
WHERE event_ts >= timestamp'2026-01-06 00:00:00'
  AND event_ts <  timestamp'2026-01-07 00:00:00'
partition directories on disk: ['event_ts_day=2026-01-05', 'event_ts_day=2026-01-06', 'event_ts_day=2026-01-07']
rows matched = 3000
scan metrics: {'scannedDataManifests': 1, 'skippedDataManifests': 2, 'resultDataFiles': 1, 'skippedDataFiles': 0}
The table is partitioned by days(event_ts); the filter names event_ts.
Iceberg applies the same transform to the predicate and matches it against
partition values in the manifests. No user needs to know the physical layout, and
nobody can forget to filter on it.
This also works across partition specs. A table whose layout changed from
month to day keeps both, and because both specs derive from source-id: 2, the
same column, one predicate prunes files under either. A table with one January
commit under months(event_ts) and two February commits under days(event_ts):
spec 0: [('event_ts_month', 'month', 2)]
spec 1: [('event_ts_day', 'day', 2)]
2026-01-06: rows=3000 scan={'scannedDataManifests': 1, 'skippedDataManifests': 2, 'resultDataFiles': 1, 'skippedDataFiles': 0}
2026-02-06: rows=3000 scan={'scannedDataManifests': 1, 'skippedDataManifests': 2, 'resultDataFiles': 1, 'skippedDataFiles': 0}
The January day was found through the month spec’s manifest, the February day through a day spec’s, and each query skipped the other two manifests.
What makes the last prune fail
Column bounds are only useful when they are narrow, and that depends entirely on how the data was written.
Rows arriving in random order put a wide range of every column in every file. The min/max then overlap across all files, no file can be excluded, and the prune does nothing — while still looking healthy in the metadata.
Sorting is the fix, and it is why WRITE ORDERED BY and sorting compaction are
not cosmetic. Measured on an unpartitioned table of eight files written in
arrival order, with the filter region = 'r5':
| Layout | Region bounds per file | Files read | Files skipped |
|---|---|---|---|
| As ingested | all eight r0..r9 |
8 | 0 |
WRITE ORDERED BY region, reading_ts, then a default rewrite |
r0..r5 to r7..r9, overlapping |
6 | 2 |
Same order, rewrite_data_files(strategy => 'sort') |
r0..r1, r1..r2, … r9..r9 |
2 | 6 |
After a sort rewrite, each file holds a narrow slice of the sort column, the
bounds stop overlapping, and filters on that column start eliminating files.
The middle row is the trap: the default rewrite_data_files strategy is
binpack, which writes with distribution mode NONE. Each writing task sorts
only the rows it was given by the table’s sort order, so every output file is
sorted inside but still overlaps its neighbours. strategy => 'sort'
range-partitions the rows across tasks first, which is what makes the ranges
separate.
Choose the sort column to match your filters. Sorting by a column nobody filters on costs a rewrite and prunes nothing.
Proving each prune fired
Pruning is invisible unless you look, and “the query was fast” is not evidence. Two ways to see it.
The Spark plan names the filters the scan received:
EXPLAIN FORMATTED SELECT * FROM ice.blog_read_path.events
WHERE event_ts >= timestamp'2026-01-06' AND event_ts < timestamp'2026-01-07'
(1) BatchScan ice.blog_read_path.events
Output [4]: [event_id#182L, event_ts#183, region#184, reading#185]
ice.blog_read_path.events (branch=null) [filters=event_ts IS NOT NULL, event_ts >= 1767657600000000, event_ts < 1767744000000000, groupedBy=]
The timestamps are microseconds since the epoch. The plan text does not tell
you how many manifests or files survived, which is the number that matters.
The scan node’s metrics do, after the query runs: the SQL tab of the Spark
UI shows them on the BatchScan node as “number of skipped data manifests”,
“number of result data files” and so on, and the scripts below read them from
the executed plan. Those are the scan metrics lines in this post.
The metadata tables answer that directly. Compare the whole table against what a filter leaves:
-- every data file in the current snapshot
SELECT count(*) AS all_files, sum(record_count) AS all_rows
FROM ice.blog_read_path.events.files;

-- what one day's partition actually holds
SELECT count(*) AS day_files, sum(record_count) AS day_rows
FROM ice.blog_read_path.events.files
WHERE partition.event_ts_day = date'2026-01-06';
+---------+--------+
|all_files|all_rows|
+---------+--------+
|        3|    9000|
+---------+--------+
+---------+--------+
|day_files|day_rows|
+---------+--------+
|        1|    3000|
+---------+--------+
If day_files is close to all_files, the partition transform is not matching
your filters and the first prune is doing nothing.
Manifest-level pruning is visible the same way:
SELECT path, added_data_files_count, partition_summaries
FROM ice.blog_read_path.events.manifests;
Each row carries a lower_bound and upper_bound. Where those ranges overlap
heavily across manifests, the manifest prune cannot discard much — which happens
when writes interleave partitions, and is what rewrite_manifests fixes by
regrouping files so each manifest covers a tight range.
When column bounds stop working
The fourth prune is the one that silently degrades, because nothing reports that it stopped helping.
SELECT file_path, readable_metrics.region.lower_bound, readable_metrics.region.upper_bound
FROM ice.blog_read_path.events.files LIMIT 5;
The raw lower_bounds and upper_bounds maps are keyed by field id, so 3 is
whichever column has field id 3; readable_metrics names them. Two failure
patterns:
Overlapping ranges. Every file spans nearly the whole domain of the column, so no filter can exclude any file. This is what unsorted ingestion produces, and the fix is a sorting compaction:
ALTER TABLE ice.blog_read_path.events WRITE ORDERED BY region, event_ts;
CALL ice.system.rewrite_data_files(table => 'blog_read_path.events', strategy => 'sort');
Without strategy => 'sort' the rewrite is a binpack, which in the measurement
above still left 6 of 8 files to read.
Bounds that are not collected. The default metrics mode is truncate(16),
but only for the first 100 columns: write.metadata.metrics.max-inferred-column-defaults
(default 100) caps how many columns get it, and every column beyond that gets
none (MetricsConfig in Iceberg core). On a table with hundreds of columns,
a filter column past the hundredth has no bounds unless you name it:
ALTER TABLE ice.blog_read_path.events SET TBLPROPERTIES (
  'write.metadata.metrics.column.region' = 'full');
counts collects value and null counts but no bounds, so no pruning.
truncate(n) stores bounds shortened to n characters, usually enough for
prefix filters. full stores complete values, which matters for long,
high-selectivity strings and costs metadata size on wide tables. Measured on
two tables holding the same clustered data, ten files with two regions each:
readings_truncate: bounds=[('r0', 'r1'), ('r0', 'r1'), ('r2', 'r3'), ('r2', 'r3'), ('r4', 'r5'), ('r4', 'r5'), ('r6', 'r7'), ('r6', 'r7'), ('r8', 'r9'), ('r8', 'r9')]
readings_truncate: region = 'r5' -> (987, {'resultDataFiles': 2, 'skippedDataFiles': 8})
readings_counts: bounds=[(None, None), (None, None), (None, None), (None, None), (None, None), (None, None), (None, None), (None, None), (None, None), (None, None)]
readings_counts: region = 'r5' -> (987, {'resultDataFiles': 10, 'skippedDataFiles': 0})
Same 987 matching rows, but with counts on region every file was read.
A filter on a column with no bounds reads every file, and the plan looks identical to one that prunes perfectly.
The cost model, stated
Planning reads, in order: one catalog call, one metadata.json, one manifest
list, then m manifests. Data files opened are whatever survives.
So planning cost is roughly O(manifests), not O(partitions) and not O(files). That has two consequences worth holding on to.
A table with 50,000 partitions and 20 manifests plans quickly. A table with 50 partitions and 20,000 manifests — which is what a per-minute streaming writer produces in two weeks — plans slowly. Partition count is not the driver; commit count is.
And because manifests are merged automatically only once
commit.manifest.min-count-to-merge (default 100) is reached, with
commit.manifest-merge.enabled (default true), every commit below that
threshold adds a manifest: twelve small appends here left twelve manifests.
The problem usually appears on tables where commits are frequent enough to
outrun that merging, not on tables that simply have a lot of data.
Why planning cost is metadata, not partitions
No step in the sequence lists a directory. That is the structural difference from Hive-style tables, where planning is a listing per partition and cost grows with partition count.
Iceberg’s planning cost grows with the number of manifests to read, which grows with the number of commits. A streaming table committing every minute accumulates manifests quickly, and the symptom is distinctive: time spent before any task starts, growing while the data stays the same size.
rewrite_manifests is the fix, and it is a different job from data compaction:
CALL ice.system.rewrite_manifests('blog_read_path.readings_stream');
manifests after 12 commits: 12
+-------------------------+---------------------+
|rewritten_manifests_count|added_manifests_count|
+-------------------------+---------------------+
|                       12|                    1|
+-------------------------+---------------------+
manifests after rewrite_manifests: 1
Twelve manifests became one, and no data file was touched.
Reading the evidence yourself
Three queries answer whether pruning can work on your table:
-- how many manifests must planning read?
SELECT count(*) FROM ice.blog_read_path.events.manifests;

-- do partition ranges separate cleanly, or do they overlap?
SELECT path, partition_summaries FROM ice.blog_read_path.events.manifests;

-- are column bounds narrow, or does every file span everything?
SELECT file_path, readable_metrics FROM ice.blog_read_path.events.files LIMIT 10;
Overlapping bounds across most files means the third prune is doing nothing, and
sorting is the lever. A large manifest count means planning is paying for
history, and rewrite_manifests is the lever.
Run it yourself
Every output above came from two scripts, run on the local lakehouse stack described in Run every demo on this blog locally: Spark 3.5.9 with Iceberg 1.11.0, a Hive Metastore catalog and MinIO.
git clone https://github.com/rangareddy/datalake-playground.git
cd datalake-playground
SPARK_VERSION=3.5.9 sh run_datalake.sh start
sh run_datalake.sh status
Snapshot ids, manifest names and expression ids differ per run, and so do the exact file boundaries of the sort rewrite, because range partitioning samples the data. Every count, including the files read and skipped, reproduced. Both scripts turn off adaptive query execution, so the scan node and its metrics sit directly in the executed plan.
read_path_funnel.py: manifests, bounds, hidden partitioning, specs
"""Walk an Iceberg read through its metadata and count what each level prunes.

Run inside datalake-playground:
  docker cp read_path_funnel.py spark-master:/tmp/
  docker exec spark-master bash -c \
    '$SPARK_HOME/bin/spark-submit --master "local[2]" --driver-memory 1g \
       --jars $(ls $ICEBERG_HOME/iceberg-spark-runtime*.jar) \
       /tmp/read_path_funnel.py'
"""
import json
import random
from datetime import datetime, timedelta

from pyspark.sql import SparkSession
from pyspark.sql.types import (DoubleType, LongType, StringType, StructField,
                               StructType, TimestampType)

spark = (
    SparkSession.builder.appName("iceberg-read-path")
    .config("spark.sql.extensions",
            "org.apache.iceberg.spark.extensions.IcebergSparkSessionExtensions")
    .config("spark.serializer", "org.apache.spark.serializer.KryoSerializer")
    .config("spark.sql.catalog.ice", "org.apache.iceberg.spark.SparkCatalog")
    .config("spark.sql.catalog.ice.type", "hive")
    .config("spark.sql.catalog.ice.uri", "thrift://hive-metastore:9083")
    .config("spark.sql.catalog.ice.warehouse", "s3a://warehouse/")
    # a plain physical plan, so the scan node and its metrics are easy to find
    .config("spark.sql.adaptive.enabled", "false")
    .config("spark.eventLog.enabled", "false")
    .config("spark.ui.enabled", "false")
    .getOrCreate()
)
spark.sparkContext.setLogLevel("ERROR")
sql = spark.sql
NS = "ice.blog_read_path"
TABLE = f"{NS}.events"

SCHEMA = StructType([
    StructField("event_id", LongType(), False),
    StructField("event_ts", TimestampType(), False),
    StructField("region", StringType(), False),
    StructField("reading", DoubleType(), False),
])


def day_of_events(day, n=3000):
    """One day of telemetry: n events, regions r0-r9 in arrival order."""
    rng = random.Random(day.toordinal())
    return [(day.toordinal() * 10_000 + i,
             day + timedelta(seconds=rng.randint(0, 86_399)),
             f"r{rng.randint(0, 9)}",
             round(rng.uniform(0, 100), 2)) for i in range(n)]


def scan_metrics(df):
    """Run the query and return the Iceberg scan's pruning counters."""
    df.collect()
    leaves = df._jdf.queryExecution().executedPlan().collectLeaves()
    for i in range(leaves.size()):
        node = leaves.apply(i)
        if node.nodeName().startswith("BatchScan"):
            m = node.metrics()
            return {k: m.apply(k).value() for k in
                    ("scannedDataManifests", "skippedDataManifests",
                     "resultDataFiles", "skippedDataFiles")}
    raise RuntimeError("no BatchScan in the plan")


sql(f"CREATE NAMESPACE IF NOT EXISTS {NS}")
sql(f"DROP TABLE IF EXISTS {TABLE} PURGE")
sql(f"""CREATE TABLE {TABLE} (event_id BIGINT, event_ts TIMESTAMP, region STRING, reading DOUBLE)
        USING iceberg PARTITIONED BY (days(event_ts))""")
for d in (5, 6, 7):                                    # one commit per day
    spark.createDataFrame(day_of_events(datetime(2026, 1, d)), SCHEMA) \
         .writeTo(TABLE).append()

print("== 3. manifest list: one partition range per manifest ==")
for r in sql(f"""SELECT path, added_data_files_count, partition_summaries
                 FROM {TABLE}.manifests ORDER BY partition_summaries[0].lower_bound""").collect():
    s = r.partition_summaries[0]
    print(f"manifest {r.path.split('/')[-1][:8]}...-m0.avro files={r.added_data_files_count}"
          f"  lower_bound={s.lower_bound} upper_bound={s.upper_bound}")

print("\n== 4. manifests: per-file partition value and column bounds ==")
for r in sql(f"""SELECT partition.event_ts_day AS day, record_count,
                        readable_metrics.region.lower_bound AS region_min,
                        readable_metrics.region.upper_bound AS region_max,
                        map_keys(lower_bounds) AS bound_field_ids
                 FROM {TABLE}.files ORDER BY day""").collect():
    print(f"day={r.day} rows={r.record_count} region=[{r.region_min} .. {r.region_max}]"
          f" bounds keyed by field ids {sorted(r.bound_field_ids)}")
print("field ids:", [(f.name, i + 1) for i, f in enumerate(spark.table(TABLE).schema.fields)])

print("\n== hidden partitioning: filter on event_ts, prune on days(event_ts) ==")
location = sql(f"DESCRIBE TABLE EXTENDED {TABLE}").where("col_name = 'Location'").collect()[0][1]
jvm = spark._jvm
data = jvm.org.apache.hadoop.fs.Path(location + "/data")
fs = data.getFileSystem(spark._jsc.hadoopConfiguration())
print("partition directories on disk:", sorted(s.getPath().getName() for s in fs.listStatus(data)))
one_day = spark.table(TABLE).where(
    "event_ts >= timestamp'2026-01-06 00:00:00' AND event_ts < timestamp'2026-01-07 00:00:00'")
print("rows matched =", one_day.count())
print("scan metrics:", scan_metrics(one_day))

print("\n== what the plan shows ==")
plan = sql(f"""EXPLAIN FORMATTED SELECT * FROM {TABLE}
               WHERE event_ts >= timestamp'2026-01-06' AND event_ts < timestamp'2026-01-07'""") \
    .collect()[0][0]
for line in plan.splitlines():
    if line.startswith(("(1) BatchScan", "Output", "Arguments")) or "filters=" in line:
        print(line[:230])

print("\n== files table: whole table against one day ==")
sql(f"SELECT count(*) AS all_files, sum(record_count) AS all_rows FROM {TABLE}.files").show()
sql(f"""SELECT count(*) AS day_files, sum(record_count) AS day_rows FROM {TABLE}.files
        WHERE partition.event_ts_day = date'2026-01-06'""").show()

print("== across partition specs ==")
EVOLVING = f"{NS}.events_evolving"
sql(f"DROP TABLE IF EXISTS {EVOLVING} PURGE")
sql(f"""CREATE TABLE {EVOLVING} (event_id BIGINT, event_ts TIMESTAMP, region STRING, reading DOUBLE)
        USING iceberg PARTITIONED BY (months(event_ts))""")
spark.createDataFrame(day_of_events(datetime(2026, 1, 6)), SCHEMA).writeTo(EVOLVING).append()
sql(f"ALTER TABLE {EVOLVING} REPLACE PARTITION FIELD months(event_ts) WITH days(event_ts)")
for d in (5, 6):
    spark.createDataFrame(day_of_events(datetime(2026, 2, d)), SCHEMA).writeTo(EVOLVING).append()
meta_file = sql(f"SELECT file FROM {EVOLVING}.metadata_log_entries ORDER BY timestamp DESC LIMIT 1").collect()[0][0]
meta = json.loads(spark.read.text(meta_file, wholetext=True).collect()[0][0])
for spec in meta["partition-specs"]:
    print(f"spec {spec['spec-id']}:", [(f["name"], f["transform"], f["source-id"]) for f in spec["fields"]])
for lo, hi in (("2026-01-06", "2026-01-07"), ("2026-02-06", "2026-02-07")):
    q = spark.table(EVOLVING).where(f"event_ts >= timestamp'{lo}' AND event_ts < timestamp'{hi}'")
    print(f"{lo}: rows={q.count()} scan={scan_metrics(q)}")

spark.stop()
bounds_and_manifests.py: sorting, metrics modes, manifest count
"""When column bounds prune, when they stop, and what manifest count costs.

Run inside datalake-playground:
  docker cp bounds_and_manifests.py spark-master:/tmp/
  docker exec spark-master bash -c \
    '$SPARK_HOME/bin/spark-submit --master "local[2]" --driver-memory 1g \
       --jars $(ls $ICEBERG_HOME/iceberg-spark-runtime*.jar) \
       /tmp/bounds_and_manifests.py'
"""
import random
from datetime import datetime, timedelta

from pyspark.sql import SparkSession
from pyspark.sql.types import (DoubleType, LongType, StringType, StructField,
                               StructType, TimestampType)

spark = (
    SparkSession.builder.appName("iceberg-bounds-and-manifests")
    .config("spark.sql.extensions",
            "org.apache.iceberg.spark.extensions.IcebergSparkSessionExtensions")
    .config("spark.serializer", "org.apache.spark.serializer.KryoSerializer")
    .config("spark.sql.catalog.ice", "org.apache.iceberg.spark.SparkCatalog")
    .config("spark.sql.catalog.ice.type", "hive")
    .config("spark.sql.catalog.ice.uri", "thrift://hive-metastore:9083")
    .config("spark.sql.catalog.ice.warehouse", "s3a://warehouse/")
    .config("spark.sql.adaptive.enabled", "false")
    .config("spark.eventLog.enabled", "false")
    .config("spark.ui.enabled", "false")
    .getOrCreate()
)
spark.sparkContext.setLogLevel("ERROR")
sql = spark.sql
NS = "ice.blog_read_path"

SCHEMA = StructType([
    StructField("reading_id", LongType(), False),
    StructField("reading_ts", TimestampType(), False),
    StructField("region", StringType(), False),
    StructField("value", DoubleType(), False),
])
START = datetime(2026, 1, 6)


def batch(seed, n=5000, regions=range(10)):
    rng = random.Random(seed)
    regions = list(regions)
    return [(seed * 100_000 + i, START + timedelta(seconds=rng.randint(0, 86_399)),
             f"r{rng.choice(regions)}", round(rng.uniform(0, 100), 2)) for i in range(n)]


def scan_metrics(df):
    df.collect()
    leaves = df._jdf.queryExecution().executedPlan().collectLeaves()
    for i in range(leaves.size()):
        node = leaves.apply(i)
        if node.nodeName().startswith("BatchScan"):
            m = node.metrics()
            return {k: m.apply(k).value() for k in ("resultDataFiles", "skippedDataFiles")}
    raise RuntimeError("no BatchScan in the plan")


def region_bounds(table):
    return [(r.lo, r.hi) for r in sql(
        f"""SELECT readable_metrics.region.lower_bound AS lo, readable_metrics.region.upper_bound AS hi
            FROM {table}.files ORDER BY lo, hi""").collect()]


def create(table, props=""):
    sql(f"DROP TABLE IF EXISTS {table} PURGE")
    sql(f"""CREATE TABLE {table} (reading_id BIGINT, reading_ts TIMESTAMP, region STRING, value DOUBLE)
            USING iceberg {props}""")


def r5(table):
    q = spark.table(table).where("region = 'r5'")
    return q.count(), scan_metrics(q)


sql(f"CREATE NAMESPACE IF NOT EXISTS {NS}")

print("== unsorted ingestion: every file spans r0..r9 ==")
T = f"{NS}.readings"
create(T)
for seed in range(4):
    spark.createDataFrame(batch(seed), SCHEMA).writeTo(T).append()
print("region bounds per file:", region_bounds(T))
print("region = 'r5':", r5(T))

print("\n== WRITE ORDERED BY, then a default (binpack) rewrite ==")
sql(f"ALTER TABLE {T} WRITE ORDERED BY region, reading_ts")
sql(f"CALL ice.system.rewrite_data_files(table => 'blog_read_path.readings', "
    f"options => map('rewrite-all', 'true', 'target-file-size-bytes', '60000'))") \
    .select("rewritten_data_files_count", "added_data_files_count").show()
print("region bounds per file:", region_bounds(T))
print("region = 'r5':", r5(T))

print("== sort rewrite ==")
sql(f"CALL ice.system.rewrite_data_files(table => 'blog_read_path.readings', strategy => 'sort', "
    f"options => map('rewrite-all', 'true', 'target-file-size-bytes', '60000'))") \
    .select("rewritten_data_files_count", "added_data_files_count").show()
print("region bounds per file:", region_bounds(T))
print("region = 'r5':", r5(T))

print("\n== metrics modes: the same clustered data, two metrics settings ==")
for name, props in (("readings_truncate", ""),
                    ("readings_counts",
                     "TBLPROPERTIES ('write.metadata.metrics.column.region' = 'counts')")):
    t = f"{NS}.{name}"
    create(t, props)
    for k in range(5):                     # each commit holds two regions: r0-r1, r2-r3, ...
        spark.createDataFrame(batch(10 + k, 2000, (2 * k, 2 * k + 1)), SCHEMA).writeTo(t).append()
    print(f"{name}: bounds={region_bounds(t)}")
    print(f"{name}: region = 'r5' ->", r5(t))

print("\n== manifests: one per commit until something merges them ==")
S = f"{NS}.readings_stream"
create(S)
for seed in range(12):
    spark.createDataFrame(batch(100 + seed, 200), SCHEMA).writeTo(S).append()
print("manifests after 12 commits:", sql(f"SELECT count(*) FROM {S}.manifests").collect()[0][0])
sql("CALL ice.system.rewrite_manifests('blog_read_path.readings_stream')").show()
print("manifests after rewrite_manifests:", sql(f"SELECT count(*) FROM {S}.manifests").collect()[0][0])
print("rows:", spark.table(S).count())

spark.stop()
Both scripts leave their tables in ice.blog_read_path. To remove them:
docker exec spark-master bash -c '$SPARK_HOME/bin/spark-sql --master "local[2]" \
  --jars $(ls $ICEBERG_HOME/iceberg-spark-runtime*.jar) \
  --conf spark.sql.catalog.ice=org.apache.iceberg.spark.SparkCatalog \
  --conf spark.sql.catalog.ice.type=hive \
  --conf spark.sql.catalog.ice.uri=thrift://hive-metastore:9083 \
  -e "DROP TABLE ice.blog_read_path.events PURGE; DROP TABLE ice.blog_read_path.events_evolving PURGE;
      DROP TABLE ice.blog_read_path.readings PURGE; DROP TABLE ice.blog_read_path.readings_truncate PURGE;
      DROP TABLE ice.blog_read_path.readings_counts PURGE; DROP TABLE ice.blog_read_path.readings_stream PURGE;
      DROP NAMESPACE ice.blog_read_path"' 2>/dev/null
# PURGE leaves empty folder markers behind
docker exec mc /usr/bin/mc rm --recursive --force minio/warehouse/blog_read_path.db/
Common misconceptions
“Iceberg is fast because it is Parquet.” The data files are the same Parquet a Hive table uses. The difference is how many of them get opened.
“Partition pruning is the optimization.” It is one of four. Manifest-level pruning happens before it, and column-bounds pruning after.
“More partitions prune better.” More partitions mean more metadata and more small files. Pruning quality comes from filters matching the partition transform and from sorted data, not from partition count.
“Statistics are collected by a separate job.” Bounds are written into manifests by the writer, as part of the commit.
“Time travel is slower.” It selects a different snapshot at step 2 and then behaves identically.
A model worth keeping
Planning is a funnel: one catalog lookup, one metadata file, one manifest list, some manifests, and then only the data files that survived.
Each level exists to avoid the level below. When queries slow down, the question is which level stopped eliminating — manifests accumulating makes step 3 expensive, and unsorted data makes step 4 useless.
References
- Iceberg table specification for scan planning and manifest contents
- Iceberg Spark queries for metadata tables and time travel syntax
- Apache Iceberg architecture for the metadata tree these steps traverse
- Life of a write query in Iceberg for how the metadata this reads gets created
- Running Iceberg in production for the maintenance that keeps planning fast
Trademarks
Apache Iceberg, Apache Spark, Apache Parquet, Apache Hive, Apache and the Apache feather logo are either registered trademarks or trademarks of The Apache Software Foundation in the United States and other countries.
Found this useful?
These posts and tools are free. If one saved you an afternoon, you can buy me a coffee.